
VAL1 — RC shear wall cyclic validation (OpenSeesPy RCshearwall / Lu et al. 2015)
Description
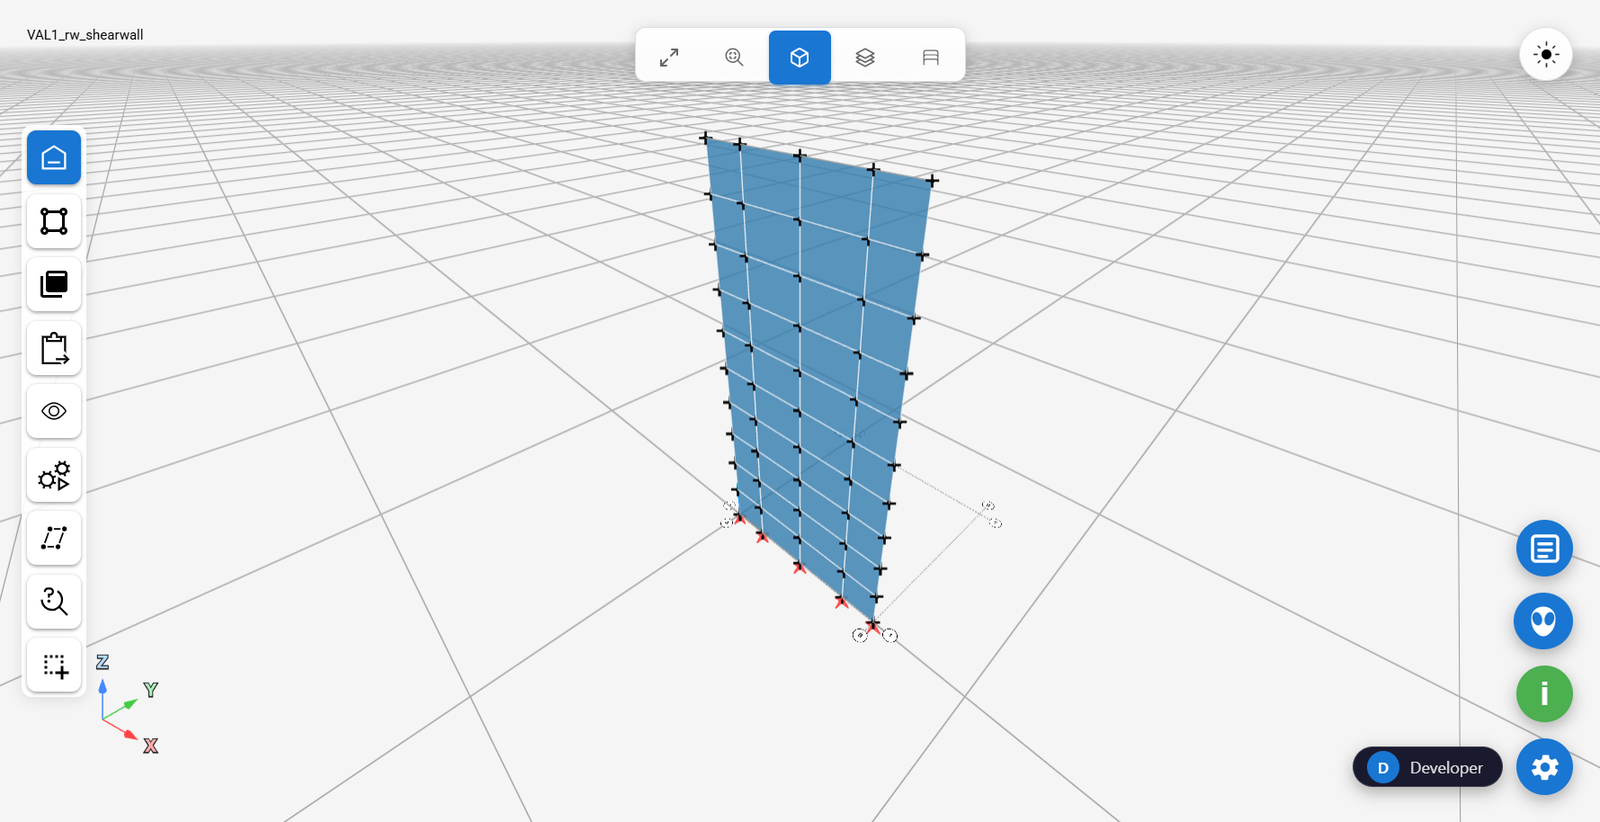
A slender reinforced-concrete shear wall under a fully-reversed cyclic lateral loading protocol, reproducing a widely used OpenSees wall-modeling benchmark.
Reference
Lu et al. (2015); OpenSeesPy's published RC shear-wall benchmark model and digitized cyclic response.
Model
A meshed reinforced-concrete wall panel, restrained at its base. The wall uses vfopro's fiber-based wall hinge: a heavier, confined reinforcement ratio assigned to the two boundary elements at the wall ends, and a lighter, unconfined reinforcement ratio assigned across the web elements between them, matching the specimen's own reinforcement layout. A fully-reversed cyclic lateral displacement protocol, extracted from the reference's own loading record, is applied at the top of the wall under displacement control.
Loading protocol applied
| Displacement amplitude (in) | Cycles |
|---|---|
| 0.08 | 1 |
| 0.2 | 1 |
| 0.28 | 1 |
| 0.36 | 1 |
| 0.4 | 1 |
| 0.48 | 1 |
| 0.6 | 1 |
| 0.68 | 1 |
| 0.8 | 1 |
| 0.84 | 1 |
Response comparison
Full loading history, physical test vs. vfopro simulation.
Comparison
| Quantity | Reference | vfopro | % diff |
|---|---|---|---|
| Peak +force @ |disp| 0.00-0.10in | 23.92 | 26.78 | +11.95% |
| Peak -force @ |disp| 0.00-0.10in | -22.53 | -28.67 | +27.27% |
| Peak +force @ |disp| 0.10-0.20in | 30.85 | 34.4 | +11.52% |
| Peak -force @ |disp| 0.10-0.20in | -31.54 | -34.24 | +8.54% |
| Peak +force @ |disp| 0.20-0.30in | 35.01 | 36.72 | +4.90% |
| Peak -force @ |disp| 0.20-0.30in | -40.55 | -36.37 | -10.32% |
| Peak +force @ |disp| 0.30-0.40in | 39.17 | 37.89 | -3.26% |
| Peak -force @ |disp| 0.30-0.40in | -43.33 | -37.73 | -12.92% |
| Peak +force @ |disp| 0.40-0.50in | 40.55 | 39.51 | -2.58% |
| Peak -force @ |disp| 0.40-0.50in | -44.71 | -39.36 | -11.97% |
| Peak +force @ |disp| 0.50-0.60in | 41.94 | 41.21 | -1.75% |
| Peak -force @ |disp| 0.50-0.60in | -45.41 | -41.49 | -8.63% |
| Peak +force @ |disp| 0.60-0.70in | 42.63 | 42.46 | -0.42% |
| Peak -force @ |disp| 0.60-0.70in | -44.71 | -42.34 | -5.31% |
| Peak +force @ |disp| 0.70-0.80in | 42.63 | 43.66 | +2.40% |
| Peak -force @ |disp| 0.70-0.80in | -41.94 | -43.84 | +4.53% |
| Peak +force @ |disp| 0.80-0.90in | -24.61 | 44.02 | -278.88% |
| Peak -force @ |disp| 0.80-0.90in | -39.86 | -44 | +10.37% |
Conclusion
Both the boundary-element and web reinforcement use a 5% post-yield hardening ratio. Under the 10% validation criterion, 10 of 18 amplitude/sign bands are within 10%. Once the specimen is past yield the positive side tracks the test closely: from 0.3 in to 0.8 in the peak force is within about 3% of the reference. The negative side is 10–13% low from 0.2 in through 0.5 in, then within about 9% from 0.5 in on, because the simulated loop is nearly symmetric while the reference loop is not (its negative peaks are larger in the mid-amplitude range). The small-displacement bands (0.0–0.2 in) over-predict force by about 12–27%, which points to the initial (pre-cracking and early-yield) stiffness of the wall model rather than its post-yield strength. The last negative band (0.8–0.9 in) is about 10% high. One row, 0.80–0.90 in “+force”, shows an implausible −279% difference: the reference trace sits near zero force in that displacement band, so a small absolute offset becomes a huge percentage — an artifact of comparing by displacement bin near a force sign change, not a real strength gap. The remaining differences are best read from the chart.
Last updated September 22, 2026 · applies to vfopro 20260922.0.0 or later